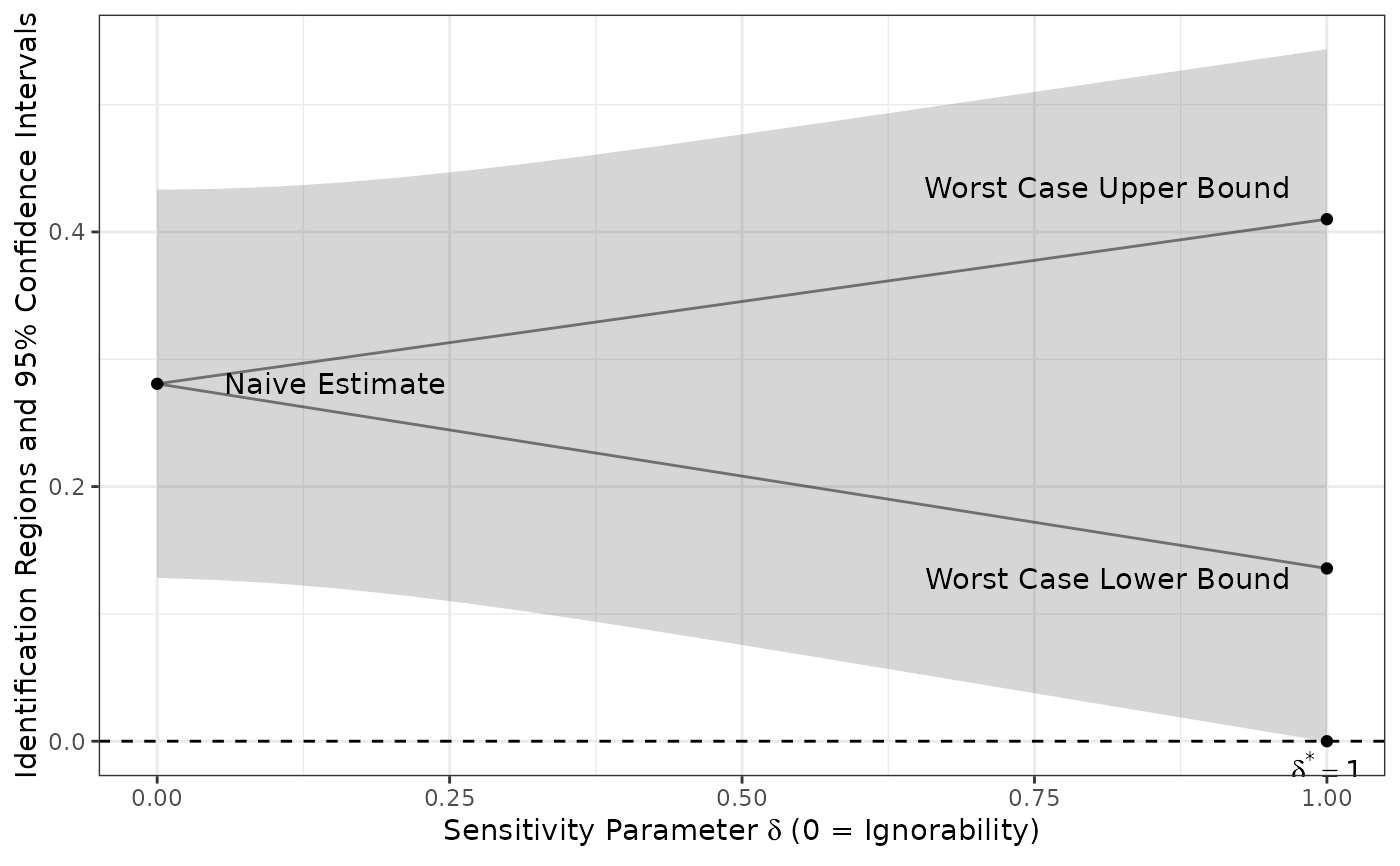
Searches over delta, the sensitivity parameter of
estimator_ds_sens, for delta*: the smallest value at which the
confidence interval starts to include zero. A delta* near zero means the
finding rests on assuming away nearly all of the missingness; a delta* near
one means it survives almost any amount. Returns the search, a plot of it, and
delta* itself, which is NA when the interval already includes zero
under ignorability.
Usage
sensitivity_ds(
  Y,
  Z,
  R1,
  Attempt,
  R2,
  minY,
  maxY,
  sims = 100,
  strata = NULL,
  alpha = 0.05,
  data
)
Arguments
- Y
The (unquoted) outcome variable, or a formula
outcome ~ treatment. Must be numeric.- Z
The (unquoted) assignment indicator variable. Must be numeric and take values 0 or 1. Ignored when
Yis a formula.- R1
The initial sample response indicator: unquoted column name, or a quoted string column name when using the formula interface. Must be numeric and take values 0 or 1.
- Attempt
The follow-up attempt indicator: unquoted column name, or quoted string. Must be numeric and take values 0 or 1.
- R2
The follow-up response indicator: unquoted column name, or quoted string. Must be numeric and take values 0 or 1.
- minY
The minimum possible value of the outcome (Y) variable.
- maxY
The maximum possible value of the outcome (Y) variable.
- sims
Number of values of delta at which to evaluate the bounds. Defaults to 100.
- strata
Stratification variable: unquoted column name or a quoted string column name.
- alpha
The desired significance level. 0.05 by default.
- data
A dataframe. Must be given by name:
datais the last argument, so passing it positionally assigns it to another argument.
Value
An object of class "attrition_sensitivity": a list with three
elements, sensitivity_plot, a ggplot object; sims_df, a data
frame of bounds and confidence intervals at each value of delta; and
delta_star, a single number giving delta*, or NA when no
delta* exists, which happens when the confidence interval already contains
zero at delta = 0. Printing reports delta*;
tidy() returns sims_df.
References
Coppock, Alexander, Alan S. Gerber, Donald P. Green, and Holger L. Kern (2017). Combining Double Sampling and Bounds to Address Nonignorable Missing Outcomes in Randomized Experiments. Political Analysis 25(2):188-206. doi:10.1017/pan.2016.6
Examples
set.seed(343)
N <- 1000
Y_0 <- sample(1:5, N, replace = TRUE, prob = c(0.1, 0.3, 0.3, 0.2, 0.1))
Y_1 <- sample(1:5, N, replace = TRUE, prob = c(0.1, 0.1, 0.4, 0.3, 0.1))
Z <- rbinom(N, 1, 0.5)
Y_star <- Z * Y_1 + (1 - Z) * Y_0
R1 <- rbinom(N, 1, prob = 0.7 + 0.1 * Z)
Y <- Y_star
Y[R1 == 0] <- NA
# Follow up intensively with a random half of the initial non-responders
Attempt <- rep(0, N)
Attempt[R1 == 0] <- rbinom(sum(R1 == 0), 1, 0.5)
R2 <- rep(0, N)
R2[Attempt == 1] <- rbinom(sum(Attempt == 1), 1, 0.9)
Y[Attempt == 1 & R2 == 1] <- Y_star[Attempt == 1 & R2 == 1]
df <- data.frame(Y, Z, R1, Attempt, R2)
sens <- sensitivity_ds(Y, Z, R1, Attempt, R2, minY = 1, maxY = 5,
sims = 20, data = df)
sens
#> Sensitivity analysis on Y
#> delta* = 1.000: the 95% confidence interval first includes zero when
#> ignorability is dropped for 100.0% of the follow-up nonrespondents.
#> Components: sensitivity_plot, sims_df (20 values of delta), delta_star
sens$sensitivity_plot
 sens$delta_star
#> [1] 1
sens$delta_star
#> [1] 1