Did Trump’s Indictments Rally His Base? Evidence from the Counterfactual Format
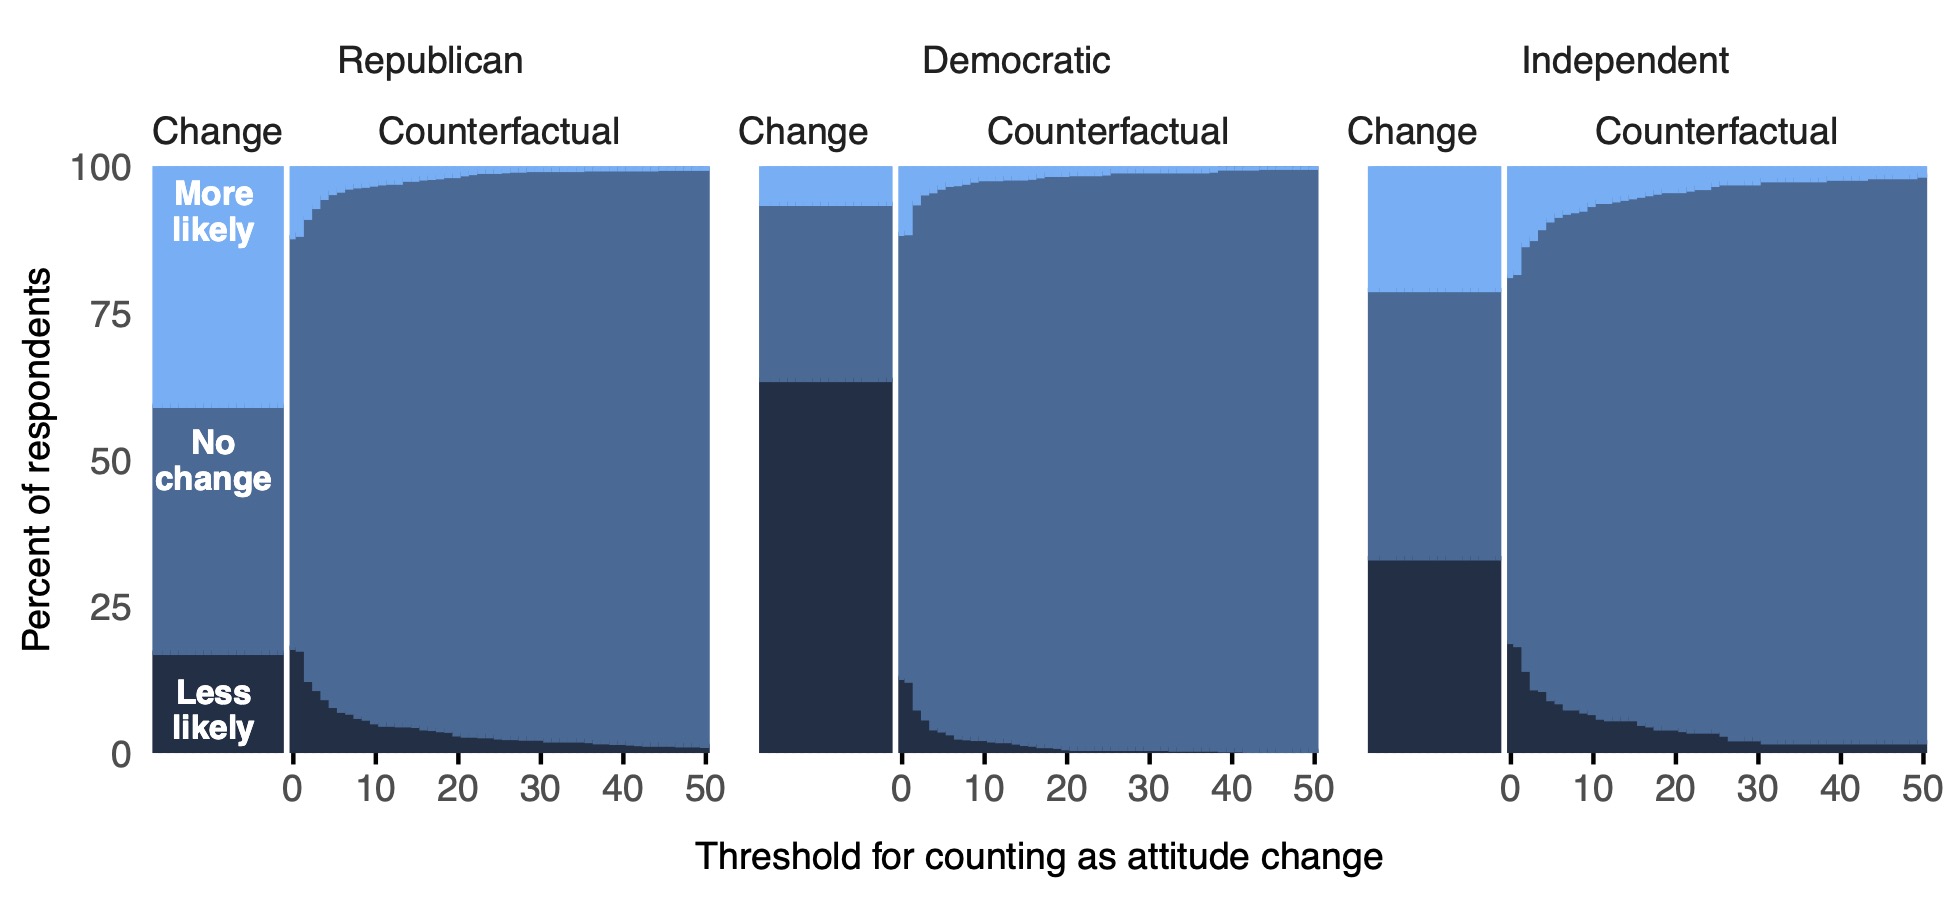
In the task of assessing how sudden, significant events causally affect public opinion, political pollsters often ask respondents how the event affected their attitudes and beliefs. We study the case of former President Donald Trump’s federal indictment for allegedly mishandling classified documents using two methods of retrospective causal inference. The commonly used change format asks respondents to state directly how the event affected their attitudes: Republicans say the event increased their support of Trump, while Democrats say the opposite. Like previous work, we argue that the change format exhibits a form of bias known as response substitution. The alternative counterfactual format is plausibly free of this source of error and asks respondents to imagine what their attitudes and beliefs would have been if the event had not happened. Using this method, Republican primary voters report that the indictment increased their belief that Trump mishandled documents (+2.5 pp) and decreased their intention to vote for him in the primaries (−1.6 pp). We argue that the counterfactual format is particularly valuable for studying the effects of highly salient news events like the Trump indictment on public opinion.