brodeur_etal_2026

Reproducibility and Robustness of Economics and Political Science Research

Brodeur, Abel and 375 coauthors. 2026. Nature 652: 151–156. doi:10.1038/s41586-026-10251-x

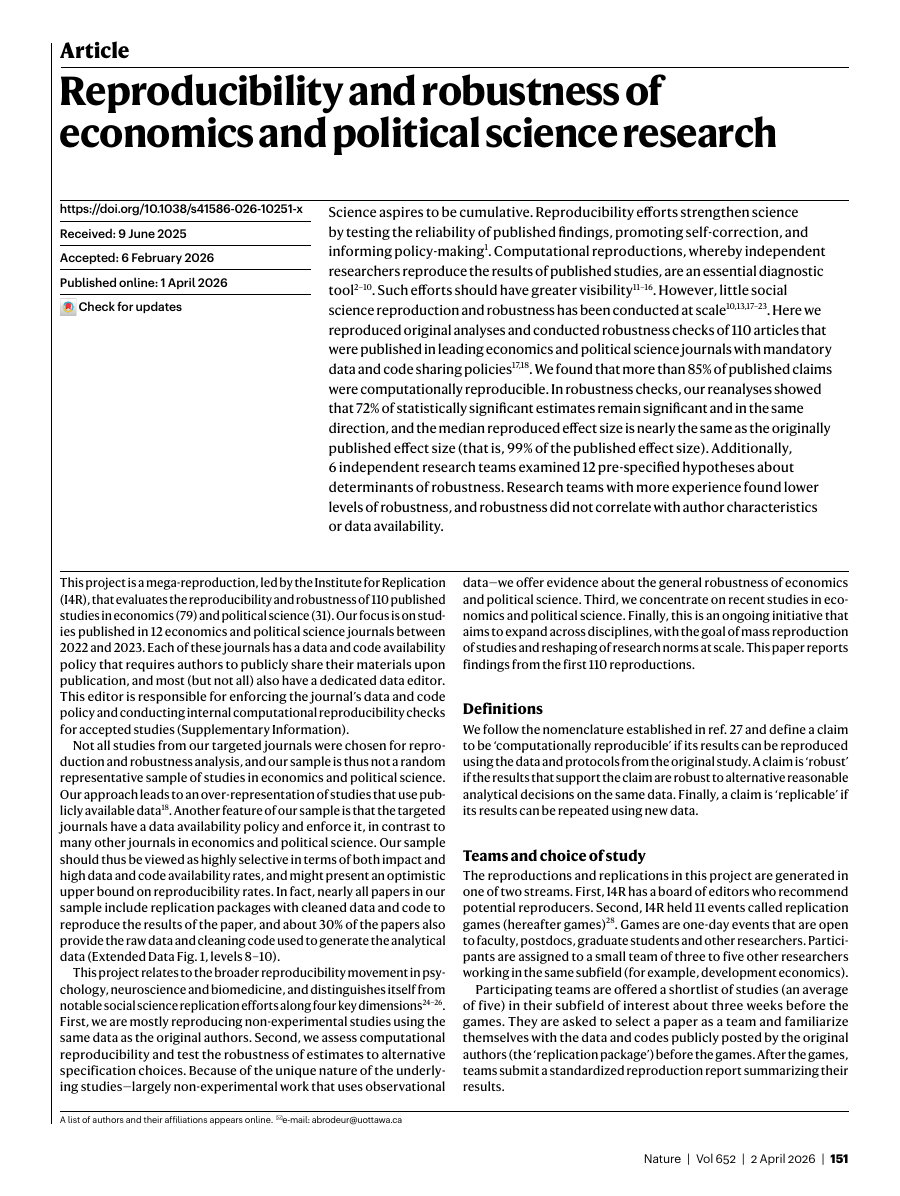
Science aspires to be cumulative. Reproducibility efforts strengthen science by testing the reliability of published findings, promoting self-correction, and informing policy-making. Computational reproductions, whereby independent researchers reproduce the results of published studies, are an essential diagnostic tool. Such efforts should have greater visibility. However, little social science reproduction and robustness has been conducted at scale. Here we reproduced original analyses and conducted robustness checks of 110 articles that were published in leading economics and political science journals with mandatory data and code sharing policies. We found that more than 85% of published claims were computationally reproducible. In robustness checks, our reanalyses showed that 72% of statistically significant estimates remain significant and in the same direction, and the median reproduced effect size is nearly the same as the originally published effect size (that is, 99% of the published effect size). Additionally, 6 independent research teams examined 12 pre-specified hypotheses about determinants of robustness. Research teams with more experience found lower levels of robustness, and robustness did not correlate with author characteristics or data availability.
brodeur_etal_2026
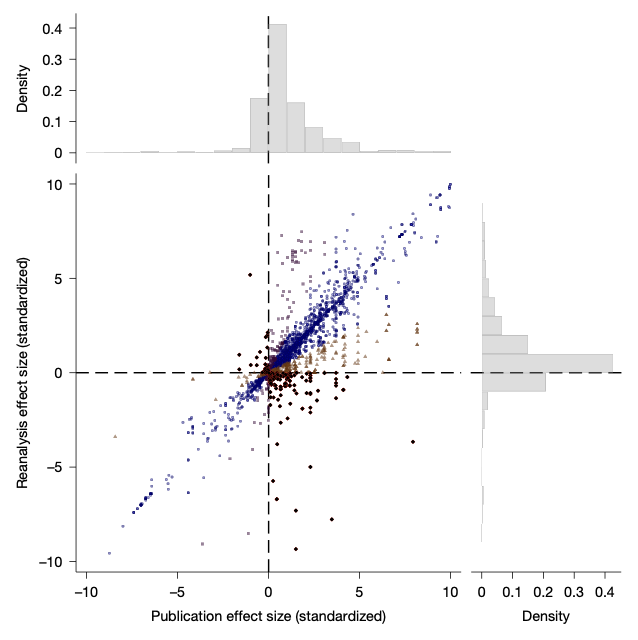
Fig. 4 from paper: Effect size of publication and reanalysis. Top histogram, distribution of originally published effect sizes standardized by the average effect size within a published article. Right histogram, distribution of reanalysis published effect sizes standardized by the average effect size within a published article. Scatter plot, each marker is a pair of effect sizes: the originally published effect size (horizontal value) and an associated reanalysis effect size (horizontal value). If an originally estimated and reanalysis effect size were of similar magnitude (and direction), the markers would gather tightly around the 45-degree line that passes through the origin. Blue circles indicate effect sizes that are similar (between 50% to 200% of the original effect size) under reanalysis: this represents 69% of the sample. Red diamonds indicate effect size estimates that switch direction under reanalysis: this represents 6% of the sample. Orange triangles indicate effect size estimates that are 50% or less of the original magnitude under reanalysis: this represents 9% of the sample. Purple squares indicate effect size estimates that are double or larger of the original magnitude under reanalysis: this represents 16% of the sample.