What Do We Learn From a Decade of Candidate Choice Conjoint Experiments?
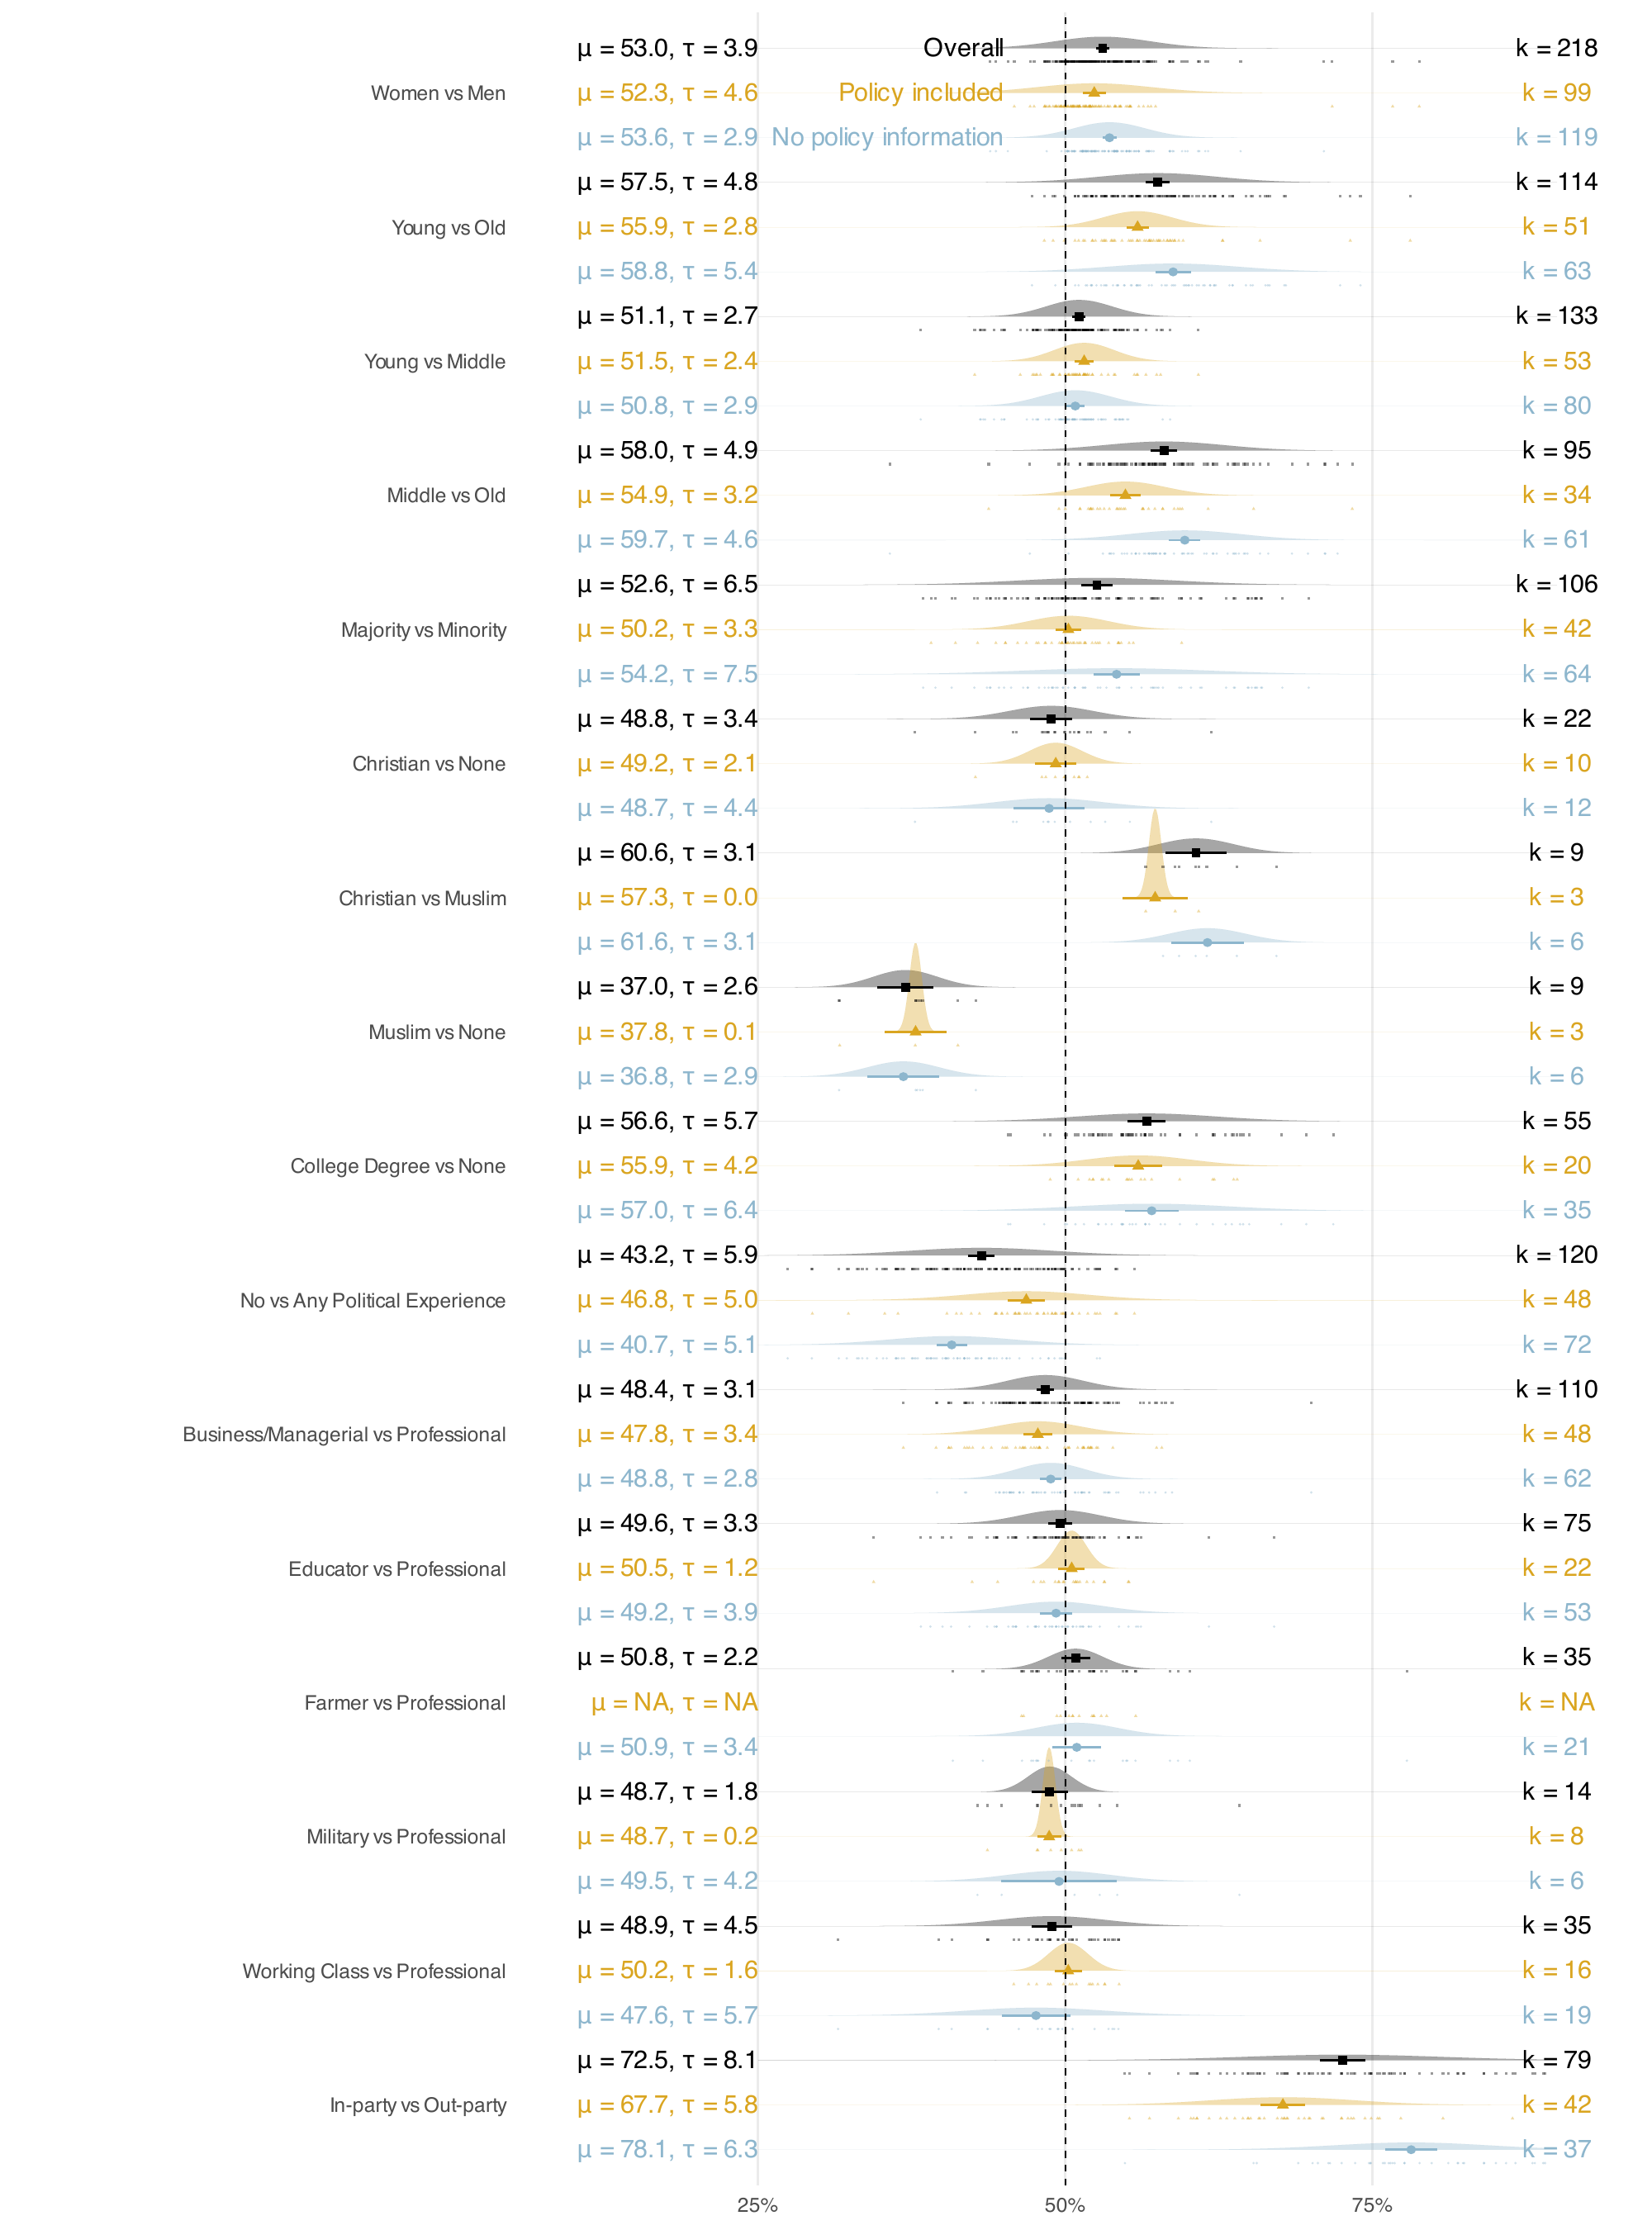
Candidate choice conjoint experiments are now among the most widely deployed designs in political science, but their lessons are scattered across hundreds of separate investigations. We present a meta-reanalysis of 243 such studies (reported in 144 papers) conducted in 52 countries among 434,079 respondents who chose between hypothetical candidates in 2,176,525 pairs. Political attributes like policy positions and partisanship exert substantially larger effects than demographic attributes such as race, gender, age, and religion, a result that informs enduring theoretical debates over substantive and descriptive representation. The effects of most attributes shrink when policy information is displayed alongside them. In US studies, respondents generally favor co-partisans over demographically similar candidates. When party and policy conflict, however, policy wins: partisans typically favor the out-partisan who shares their policy views over the co-partisan who does not.