Arrange over-plotted points with a circle-packing algorithm
position_circlepack.RdThis function uses a circle packing algorithm from the 'packcircles' package to arrange perfectly over-plotted points of varying sizes into a elliptical area.
Arguments
- density
The density of the circle pack, which defaults to 1 but will have to be adjusted in most cases. The desirable density will depend on both the ranges of the axes and the dimensions of the image. It will also depend on the size scale.
- aspect_ratio
An aspect ratio adjustment to compensate for distortion of the circular arrangement, which might occur when plotting if coord_equal() is not used. A wide aspect ratio (eg. 2) would adjust for vertical stretching, whereas a tall aspect ratio (eg. 0.5) would adjust for horizontal stretching. The default aspect ratio of 1 is appropriate when no adjustment is required.
See also
Other Functions:
position_circlepackdodge(),
position_jitter_ellipse(),
position_jitterdodge_ellipse(),
position_sunflower(),
position_sunflowerdodge(),
sunflower()
Examples
library(ggplot2)
library(dplyr)
#>
#> Attaching package: ‘dplyr’
#> The following objects are masked from ‘package:stats’:
#>
#> filter, lag
#> The following objects are masked from ‘package:base’:
#>
#> intersect, setdiff, setequal, union
library(randomizr)
library(tibble)
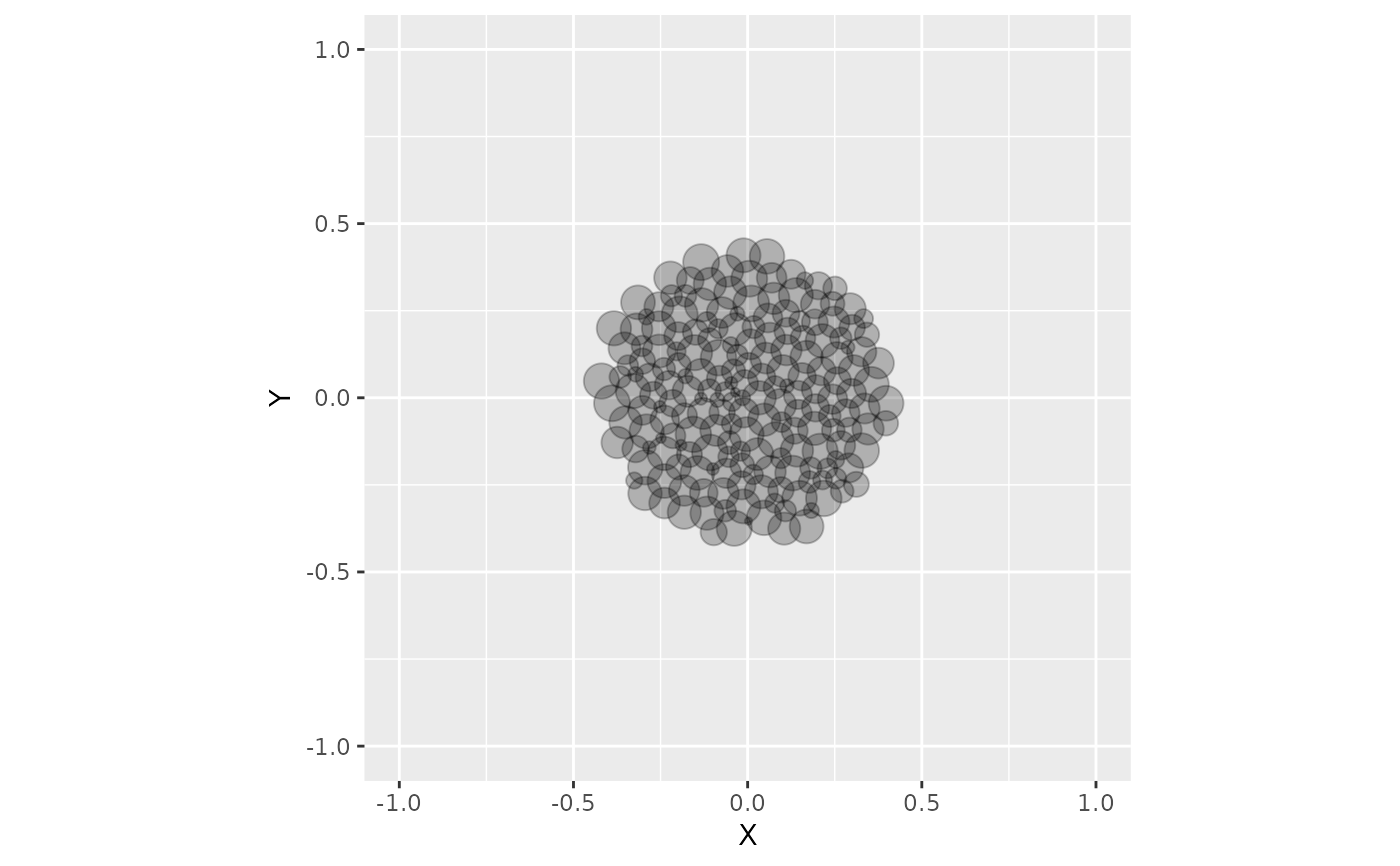
dat <- data.frame(
X = c(rep(0, 200)),
Y = rep(0, 200),
size = runif(200, 0, 1)
)
ggplot(dat, aes(x = X, y = Y, size = size)) +
geom_point(position = position_circlepack(density = 0.25, aspect_ratio = 1),
alpha = 0.25) +
coord_equal(xlim = c(-1, 1), ylim = c(-1, 1), expand = TRUE) +
theme(legend.position = "none")
 # Applied to a mock experiment with weighted groups
dat <-
tibble(
age_group = rep(c("young", "middle", "old"), c(100, 200, 300)),
treatment = block_ra(age_group, block_m = c(50, 50, 50)),
latent_outcome =
case_when(age_group == "young" & treatment == 0 ~ 0.10,
age_group == "young" & treatment == 1 ~ 0.20,
age_group == "middle" & treatment == 0 ~ 0.40,
age_group == "middle" & treatment == 1 ~ 0.45,
age_group == "old" & treatment == 0 ~ 0.70,
age_group == "old" & treatment == 1 ~ 0.90),
outcome = rbinom(600, size = 1,
prob = latent_outcome)
)
dat <-
dat |>
mutate(
treatment_prob =
case_when(age_group == "young" ~ 50/100,
age_group == "middle" ~ 50/200,
age_group == "old" ~ 50/300),
weights = 1/case_when(treatment == 1 ~ treatment_prob,
treatment == 0 ~ 1 - treatment_prob)
)
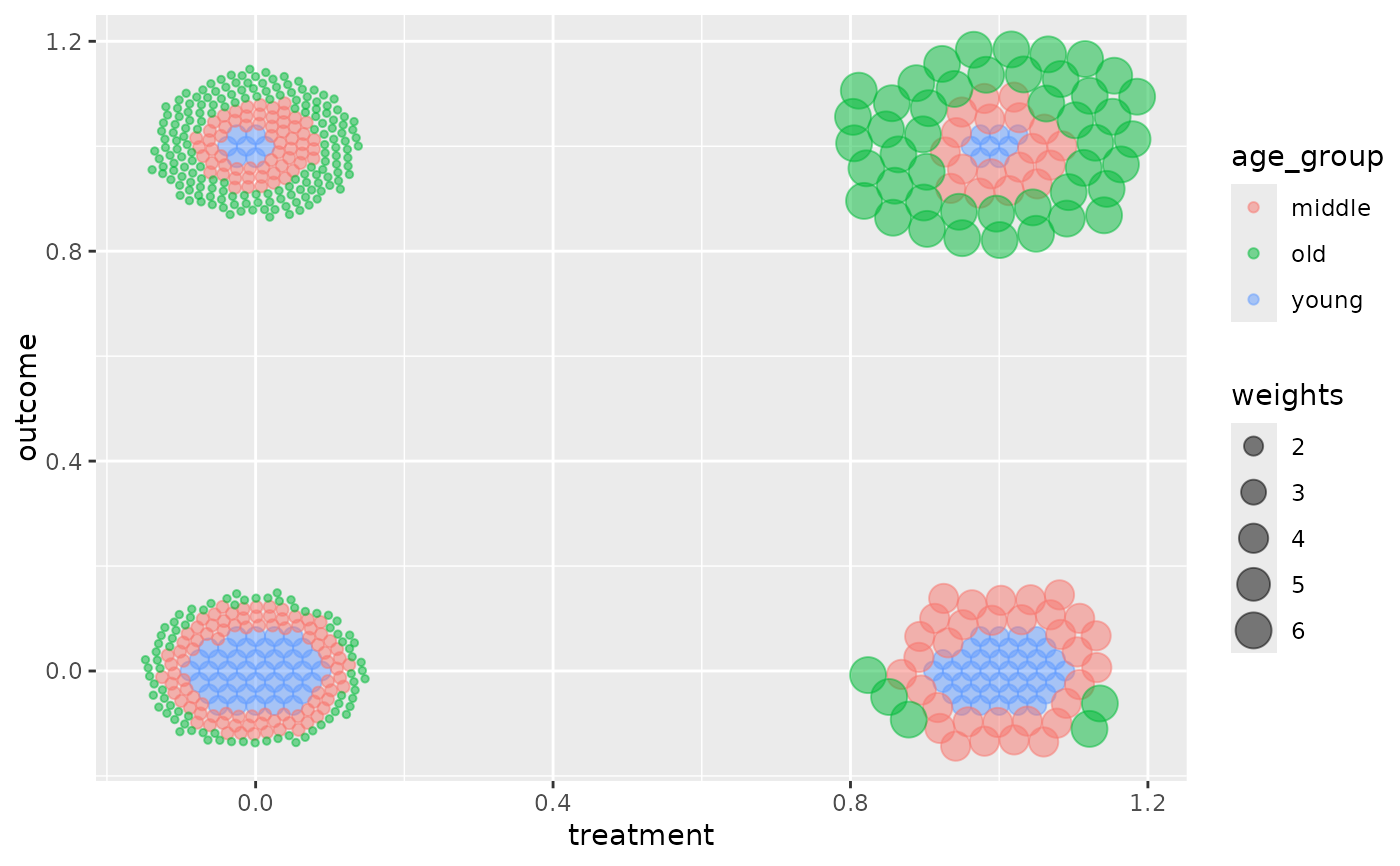
ggplot(dat, aes(treatment, outcome, size = weights, color = age_group)) +
geom_point(alpha = 0.5, position = position_circlepack(density = 0.5))
# Applied to a mock experiment with weighted groups
dat <-
tibble(
age_group = rep(c("young", "middle", "old"), c(100, 200, 300)),
treatment = block_ra(age_group, block_m = c(50, 50, 50)),
latent_outcome =
case_when(age_group == "young" & treatment == 0 ~ 0.10,
age_group == "young" & treatment == 1 ~ 0.20,
age_group == "middle" & treatment == 0 ~ 0.40,
age_group == "middle" & treatment == 1 ~ 0.45,
age_group == "old" & treatment == 0 ~ 0.70,
age_group == "old" & treatment == 1 ~ 0.90),
outcome = rbinom(600, size = 1,
prob = latent_outcome)
)
dat <-
dat |>
mutate(
treatment_prob =
case_when(age_group == "young" ~ 50/100,
age_group == "middle" ~ 50/200,
age_group == "old" ~ 50/300),
weights = 1/case_when(treatment == 1 ~ treatment_prob,
treatment == 0 ~ 1 - treatment_prob)
)
ggplot(dat, aes(treatment, outcome, size = weights, color = age_group)) +
geom_point(alpha = 0.5, position = position_circlepack(density = 0.5))