Distribute points using a sunflower seed algorithm
sunflower.RdThis function distributes points in an ellipse via a sunflower seed algorithm as a solution for over-plotting. To implement the algorithm, this function adapts the code from https://stackoverflow.com/questions/28567166/uniformly-distribute-x-points-inside-a-circle.
Arguments
- x, y
The identical coordinates of multiple over-plotted points, as vectors, which will be arranged using a sunflower seed algorithm. A vector of length one is returned unchanged, since a point with nothing over-plotting it belongs at its own coordinates.
- density
The pattern density.
- aspect_ratio
An aspect ratio adjustment to compensate for distortion of the circular arrangement, which might occur when plotting if coord_equal() is not used. A wide aspect ratio (e.g., 2) would adjust for vertical stretching, whereas a tall aspect ratio (e.g., 0.5) would adjust for horizontal stretching. An aspect ratio of 1 is appropriate when no adjustment is required.
Details
This is the engine position_sunflower() runs on, exported so that the
arrangement can be computed as data rather than at draw time. Reach for it
when another layer needs the arranged coordinates, or when writing a
Position class of your own: call it once for x and once for y, as
PositionSunflower does. The two calls agree because the arrangement is
determined by the number of over-plotted points, so the same point is placed
at the same angle in both. The package's other algorithms do not decompose
that way and have no equivalent function.
Examples
library(ggplot2)
library(dplyr)
# Arrange the points as data, keeping the position each one came from, so
# that a second layer can draw from the cell centre out to each point. A
# position adjustment cannot do this, because it arranges at draw time and
# the arranged coordinates never reach the data.
N <- 300
dat <- data.frame(
x = sample(1:2, size = N, replace = TRUE),
y = sample(1:7, size = N, replace = TRUE)
) |>
group_by(x, y) |>
mutate(
x_flower = sunflower(x = x, density = 1, aspect_ratio = 1),
y_flower = sunflower(y = y, density = 1, aspect_ratio = 1)
)
ggplot(dat, aes(x_flower, y_flower)) +
geom_segment(aes(xend = x, yend = y), colour = "grey80") +
geom_point() +
coord_equal()
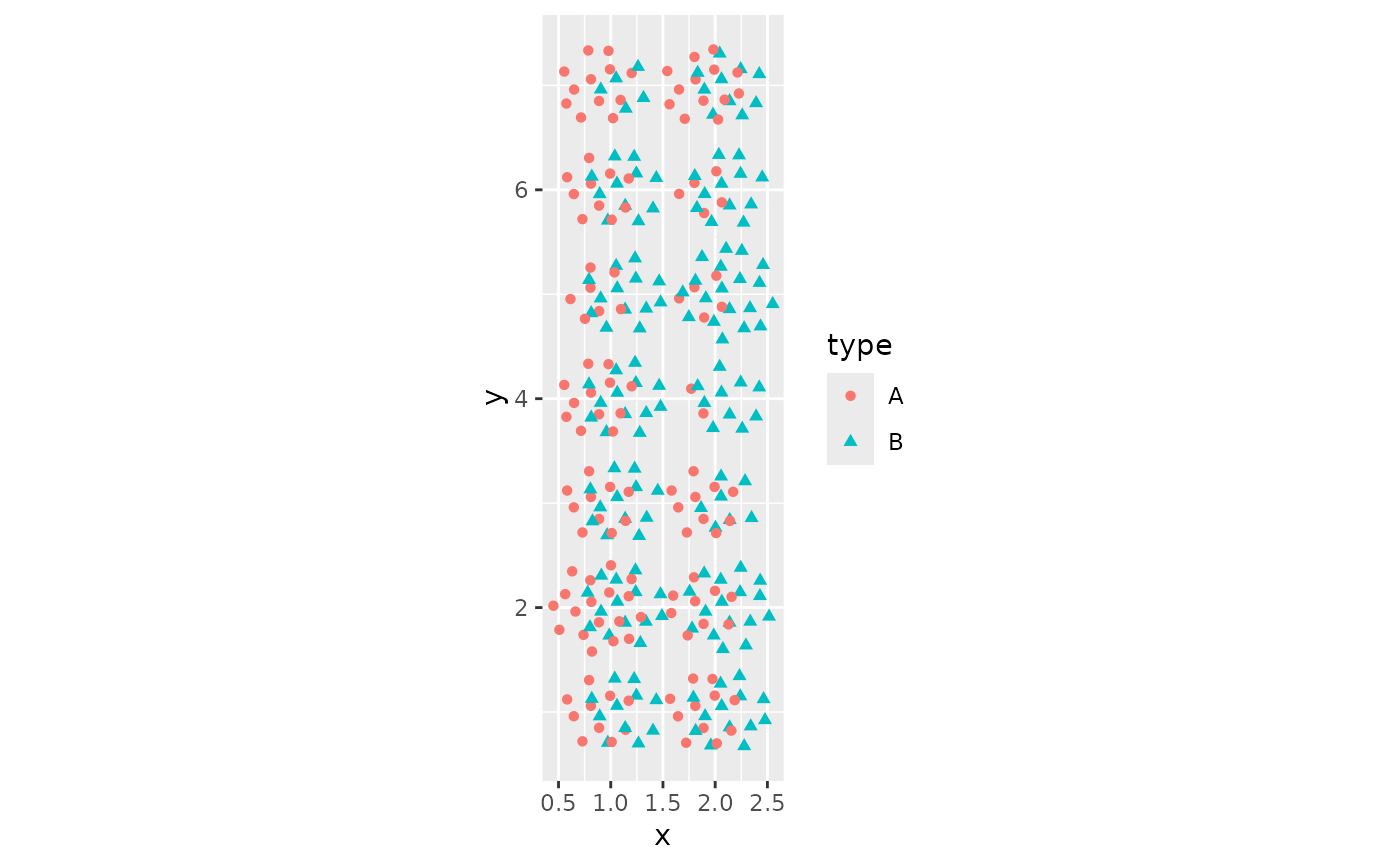 # To dodge groups as well, use position_sunflowerdodge(), which handles the
# dodging and the arrangement together and accepts an orientation.
# To dodge groups as well, use position_sunflowerdodge(), which handles the
# dodging and the arrangement together and accepts an orientation.